반응형

 GoJS - Interactive JavaScript Diagrams for the Web

GoJS is a JavaScript and TypeScript library for building interactive diagrams and graphs

From simple flowcharts and org charts to highly-specific industrial diagrams, SCADA and BPMN diagrams, medical diagrams such as genograms and outbreak modeling diagrams, and more. GoJS makes constructing graphs of complex nodes, links, and groups easy with customizable templates and layouts.

GoJS offers advanced features for user interactivity such as drag-and-drop, copy-and-paste, in-place text editing, tooltips, context menus, automatic layouts, templates, data binding and models, transactional state and undo management, palettes, overviews, event handlers, commands, extensible tools for custom operations, and customizable animations.

We maintain hundreds of sample diagrams, detailing different examples of interactivity, templates, and user logic for you to start from. We offer free developer-to-developer support during evaluation.

Flowcharts

Build interactive flowcharts or flow diagrams. Let your users build, modify, and save Diagrams with JSON model output.

State Charts

Visualize State Charts and other behavior diagrams. Create diagrams with live updates to monitor state, or interactive diagrams for planning.

Sankey Diagrams

GoJS allows considerable customization of Links and Nodes to build all kinds of diagrams. Visualize flow, or connect pipes

Genogram Diagrams

Create Genogram and Medical diagrams, or editable family trees with collapsible levels.

Org Charts

Create classic org charts for viewing or editing. Automatic layouts make different visualization options easy.

Dynamic Ports

Dynamically add ports and custom link routing. Use data-bindings to save and load routes within the Model JSON.

Industrial Processes

Model industrial processes, workflows, SCADA diagrams and more. Permissions and validation make it easy to add rules and constraints when your customers build diagrams.

Dynamic Grouping

Use groups as containers and subgraphs, with group members bounds by their own rules and layouts.

반응형
반응형

[JS] 14일 만에 GitHub 스타 천 개 받은 차트 오픈소스 개발기


:bar_chart: Re-usable, easy interface JavaScript chart library based on D3 v4+:chart_with_upwards_trend: 


billboard.js is a re-usable, easy interface JavaScript chart library, based on D3 v4+.

Documents

Playground

Play with the diverse option generating on the fly!

Supported chart types

Chart Types


1. 14일만에 GITHUB 스타 1K 받은    차트 오픈소스 개발기    박재성

2. 차트란 무엇인가?


3. 훗 차트, 너란녀석1) 데이터의 시각화 2) 차트 라이브러리? 1)의 구현을 위한 도구 그러나 차트의 적용은 무엇일까?  결국, 시각화가 기본이다. UI(디자인) + 인터렉션  구현(적용)이 관건


4. CHARTS ARE EVERYWHERE iOS 10  89% iOS 9  9% Earlier  2%


5. 차트 같은걸 끼얹나? 차트는 자주 접하지만, 개발은 그렇지 않다. 한번 개발(또는 경험)되더라도 지속적인  개선 요인이 별로 없어 경험 향상이 어렵다.

6. YOU, 차트 개발 해야함 몇 가지의 선택지들 직접 개발한다. 외부 라이브러리를 사용한다.  → 상용 or 오픈소스 어떤 기술을 사용할 것인가?  → Vector(SVG) or Bitmap(Canvas)


7. 그래, 직접 개발!Good Luck! 진심으로 행운을 빕니다.   

https://giphy.com/gifs/starwars-star-wars-force-3ohuPdEqZR8tDeuN3O


8. 역시, 외부 라이브러리!상용 or 오픈소스? 상용 → 결국 비용의 문제  라이센스 비용 부담 (ex. Highcharts 10 developer $3,320) 오픈소스 → 어떤 라이브러를 사용할 것인가?  결정의 어려움 (많은 고려요소 필요)

9. 다양한 차트 라이브러리어떤 것을 선택할 것인가?  [참고] https://bestof.js.org/tags/chart

10. 기술 선택 가이드 성능 중요(빠른 대용량 데이터 처리),  상대적으로 디자인은 덜 중요한 경우 → Canvas (비트맵) 디자인 및 요소별 커스터마이징,  다양한 해상도(Zoom) 중요 → SVG (벡터) [참고] SVG 대 캔버스: 선택 방법

11. 영역별 다른 관점, 디자인 보단 실시간 변화 표현 중요 대용량 트래픽의 실시간(realtime) 변화 확인 수치의 변화가 중요. 기본 디자인 사용에 문제 없음 관리도구 등에 적합. 소수의 참여자(admin)

12. 영역별 다른 관점, 엔드 유저대상, 다양한 디자인/UX 중요 주로 정적인 데이터의 시각화 디자인과 UX 적용의 유연성 필요 대규모의 불특정 사용자(엔드유저)를 대상

13. 그간 네이버에서의 차트서비스들마다 다른 라이브러리를 사용 그리고 그로 인한 다양한 문제

14. 문제들 기술적 know-how 축적 안됨 상용 라이브러리 사용시 비용 문제 경험이 누적되지 않아 차트 적용(디자인/개발)시,  매번 반복되는 리소스의 낭비

15. 물론, 처음엔 자체 개발 그러나, 성공적이진 못했다. 서비스 적용 이후, 메인터넌스 잘 안됨 개발 주체의 부재상황(이직 등)  또는 다른 서비스 개발 등으로 인한 지원 어려움 타 라이브러리 대비 범용성 부족

16. 그렇다면 오픈소스 사용은 어떨까? 지속적 업데이트, 기술적 트렌드 반영, 안정성 등을  기대할 수 있으니 합리적이지 않을까? 향후 오픈소스 업데이트 지속되지 않을 경우,  fork를 통한 유지 고려도 가능 공통된 라이브러리를 사용하면, 각각 다른 라이브러리 사용으로 인한 관리 및 기술경험 누적되지 않는 이슈 해결 기대 [참고] 그간 사용되었던 다양한 차트 라이브러리들:  ,  ,  ,  ,  , etc.NVD3 C3.js Chart.js Highcharts echarts

17. 직접 개발도 해봤고, 외부(상용/오픈)의 것도 사용해 봤으니 간접적인 형태로 접근해 보자 라이브러리의 발전은 생태계에 맡기자. 필요한 기능은 PR을 통해 해결 오픈소스는 일정 수준 검증 되었다. 다양한 문서, practice가 존재한다.

18. 그래서, 만들다. C3.JS 확장 라이브러리 개발

19. C3.JS 선정이유 가장 인기있는 D3.js 기반 한정 Popularity 비교:  → GitHub star, 써드파티 앱, StackOverflow 질문 수, etc. 간결한 인터페이스 풍부한 문서, 예제 등  → 구글검색 결과: C3.js(22만) Vs. NVD3(6만4천) 네이버 서비스들에서 이미 다수에서 사용 엔드 유저 대상이므로, 디자인/기능 커스터마이징 용이성 중요

20. 개발 시작 고난의 시작

21. 개발시 겪게 되는 문제들 커뮤니케이션 디자인 & 인터렉션 커스터마이징 그리고 또 그리고 수많은...

22. 커뮤니케이션나의 이름은 무엇 인가요?  차트 개발 경험이 많이 없는 경우, 부르는 명칭도 제각각

23. 디자인 가이드 각 요소들의 크기와 위치를 가이드에 맞춰주세요.

24. OMG! SVG TEXT I'm SVG text 텍스트 스타일링은 가능 <br> 같은거 안됨. 줄바꿈은 새로운 노드로 위치(via attributes) 여백 등의 조정이 어려움  → transform:translate 또는 <tspan> 사용

25. 모바일 환경 C3.js는 모바일 환경 미지원 Swipe 제스처를 통한 데이터 확인 UX 필요


26. 환경별 다른 이벤트 발생 터치하고 바로 떼었을 때


 iOS 11 (iPhone 7) touchstart → touchend → mouseover → mousemove → mouseout (포커스 이동되면 발생)

 Android 7 (Galaxy S8) touchstart → touchend → mouseover → mousemove → mousedown → mouseup → click → mouseout (포커스 이동되면 발생) http://jsbin.com/xiyara


27.   최소값y축 기반 값에 따른 up/down 표현 0 1 2 3 4 100,000 100,500 101,000 101,500 102,000 102,500 103,000 103,500 104,000 0 1 2 3 4 0 10,000 20,000 30,000 40,000 50,000 60,000 70,000 80,000 90,000 100,000 110,000 위의 차트는 모두 동일한 값을 표현하고 있습니다.

28. 데이터는 없지만, 데이터는 표현해야 한다? 데이터가 0인 경우,  표현이 되어야 할까? 안되어야 할까? 

29. C3+ C3.JS 확장 라이브러리를 만들다.

30. C3+? C3.js를 확장한 테마 형태의 디자인 차트 생성 C3.JS: 확장 + 기능 보완 + 테마 커스텀 축 지원 범례 템플릿 모바일 지원 테마를 통한 차트 생성 확장 옵션

31. 블로그/포스트 통계 적용[네이버 블로그] 블로그 통계가 새로워졌습니다! [네이버 포스트] 훨씬 좋아진 통계, 지금 제공합니다!

32. C3+ GOAL 매번 다른 기술/라이브러리를 다루는  반복적인 비용 제거 기본적 디자인(테마)을 활용해  커스터마이징(디자인)에 따른 비용 제거 기술적 경험 축적: SVG, D3, C3.js

33. BUT, 현실적 문제직면 장기적 관점에서, C3+ 발전을 위해 외부 공개 목표 하지만, 래퍼/애드온 형태의 지속적 발전과 효용성 의문 기반 라이브러리인 C3.js 지속성 의문 오픈소스의 발전에 기댈 수 있을 것이란 기대는  C3.js의 더딘 발전(또는 중단?)으로 위기 직면

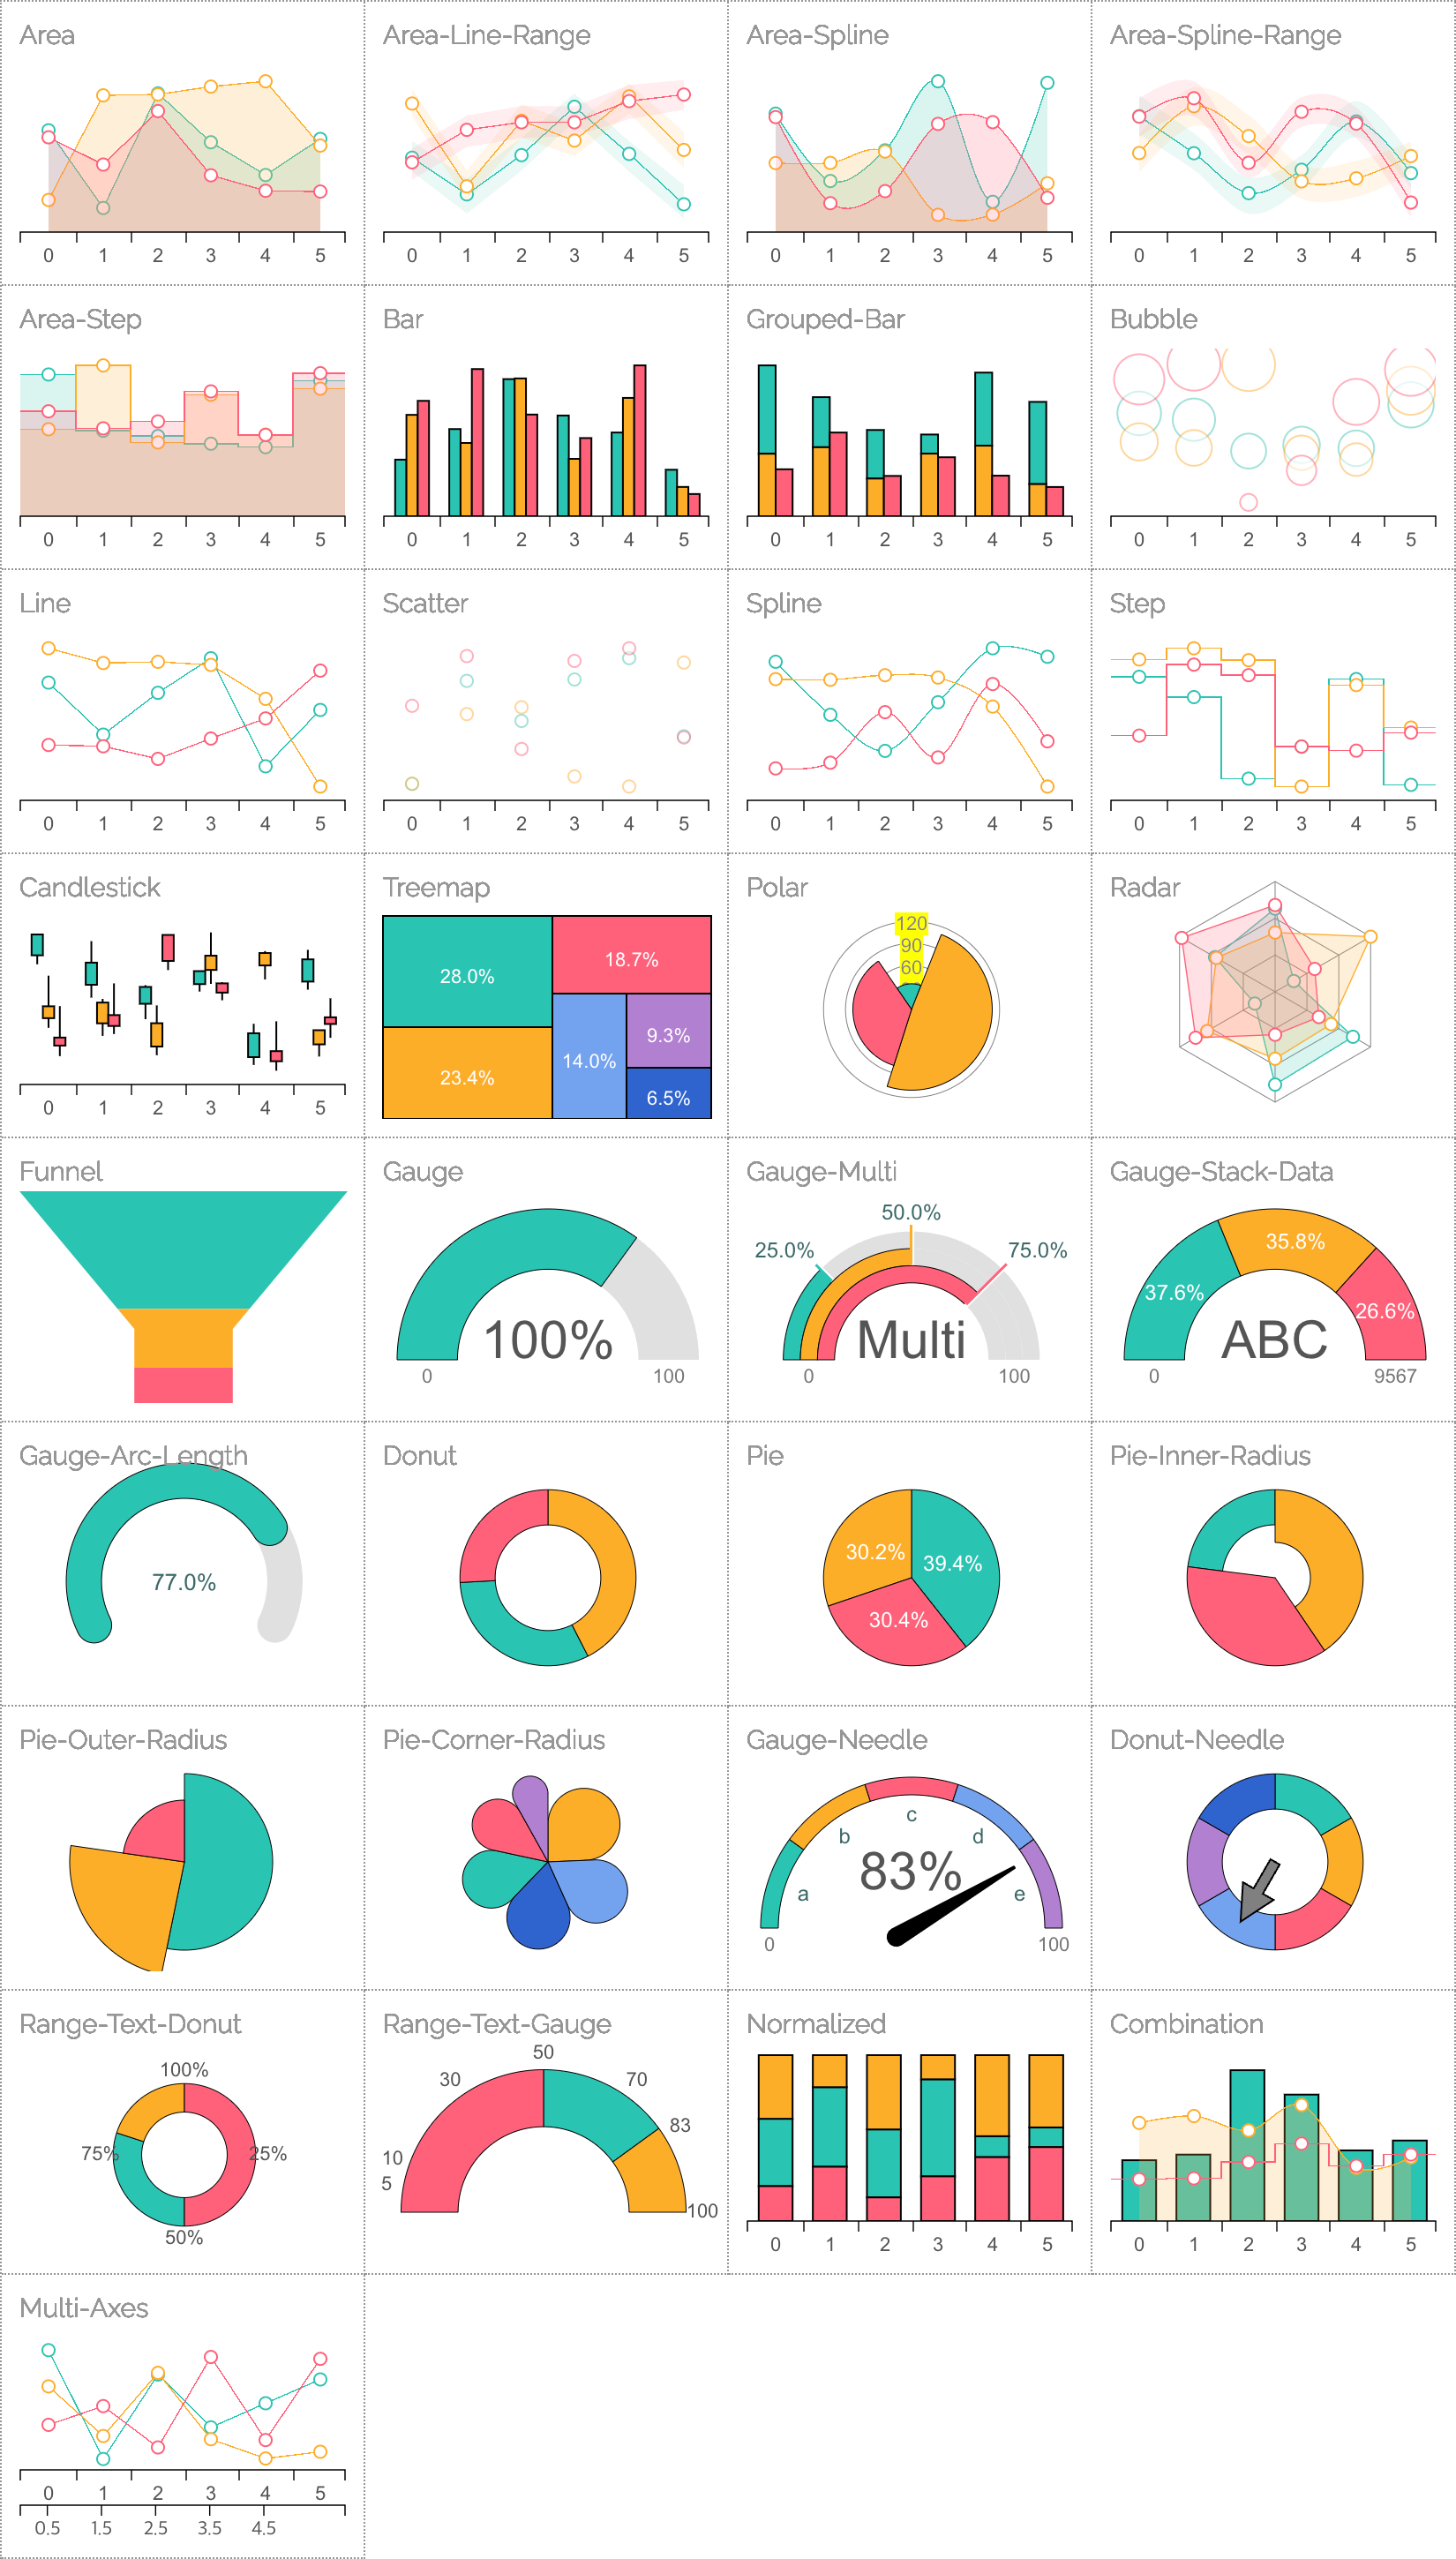
34. Re-usable, easy interface JavaScript chart library based on D3 v4+

35. 차트를 만들어 봅시다.

36. STEP 1 파일을 로딩 합니다.<!-- D3.js를 로딩 --> <script src="https://d3js.org/d3.v4.min.js"></script> <!-- billboard.js와 기본 스타일을 로딩 --> <script src="billboard.js"></script> <link rel="stylesheet" href="billboard.css">

37. STEP 2 차트가 노출될  영역을 설정합니다. <div id="chart"></div>

38. STEP 3 옵션과 함께 차트를 생성합니다. Declarative API bb.generate({ bindto: "#chart", data: { columns: [ ["data1", 30, 200, 100, 400, 150, 250], ["data2", 100, 80, 130, 240, 350, 90], ["data3", 150, 120, 58, 135, 258, 159] ], type: "bar", colors: { data1: "#2acefd", data2: "#f87070", data3: "#1f77b4" }, labels: true } });

39. 짠! bar   line   spline   pie   gauge   area‑spline   step   donut   scatter 30 200 100 400 150 250 100 80 130 240 350 90 150 120 58 135 258 159 0 1 2 3 4 5 0 50 100 150 200 250 300 350 400 450 data1 data2 data3

40. 커스터마이징150개 이상의   제공 SVG 노드: 필요한 경우, 직접 핸들링 가능  CSS로 스타일링 가능  다양한 옵션

41. THE UNKNOWN WAY TO FORK에서 공개까지

42. C3.JS 프로젝트 참여 시도원 개발자 및 커미터에게 메일을 통한 문의 

43. 일단 활동하자PR도 보내고 이슈들에 대한 답변도 하고 [참고] https://github.com/c3js/c3/issues/1924#issuecomment-271224192

44. 그렇게 몇 주가 흘렀지만 메일 회신도 없고, 프로젝트 ACTIVITY도 딱히 없는 상태...

45. 공개적 문의issue를 등록해 공개적으로 프로젝트 유지 문의 [참고] https://github.com/c3js/c3/issues/1965

46. 그리고, 그 다음날

47. 그래, FORK 하자'향후 오픈소스의 업데이트 지속 안될 경우,  fork를 통한 유지'의 명제 당면한 C3.js의 미해결 과제들: D3 최신버전 v4+ 미지원 모바일 환경에 대한 지원 부족 오래된 개발 스타일 코드 (ES3) SVG polyfill 제거 등등...

48. 합리성, 당위성 & 신뢰 Fork 한다고 해서 사용자가 오진 않는다. 기존 커뮤니티에 당위성이 제시 필요 과연 이 사람(개발자)이 믿을만 한가?

49. THE JOURNEY GOING FROM D3 V3 TO V4  WITHIN TWO MONTHS

50. OOPS~, D3 V4v3 → v4: Breaking Changes  공식 문서( ) 있으나,  마이그레이션 가이드 없고 만들지 않을거임.  Changes in D3 4.0 [참고]   https://github.com/d3/d3/issues/2893 D3 V4 - What's new?

51. D3 V4로 업그레이드변경된 모듈에 대한 목록을 모두 작성  v3 v4 d3.time.scale d3.scaleTime d3.svg.line() d3.line d3.behavior.drag d3.drag ... 모듈의 behavior 변경되어, 기존과 유사한 것도 있지만  다르게 처리되는 것들이 대다수 이전 버전과 변경된 문서를 읽고 비교하고, 테스트 하고...

52. 그외 작업들 차트 생성 흐름에 따른 오류들의 순차적 해결/변환 ES3 → ES6로 전환 병행 및 개발 환경 변경 API 문서화 ( ) 테스트 코드 업데이트(d3 v4 호환) 및 커버리지 개선 JSDoc

53. RELEASE 3주전 YAY~!, 이제 끝이 보인다.

54. 어느 날, 갑자기 두둥~ 갑작스러운 C3.js 차기 릴리즈 계획과 새로운 커미터 추가 [참고] https://github.com/c3js/c3/issues/2033

55. 고민이미 많은 진전을 통해 릴리즈를 앞둔상황 계획만을 통한 발전에 대한 의문 커미터 추가 후에도 활발한 활동 없어,  빠른 시일 내 D3 v4 지원 어렵다는 판단 계획대로  릴리즈 하자.

56. 오픈소스 네이밍원래는 C3+ 2.0으로 계획, 그러나 C3.js 연관성의 부정적 의견 'billboard'는 음악 차트 의미는 다르지만 '차트'를 연관 오랫동안 친숙한 이름 FE 프로젝트에서는 기 등록된 npm 모듈명 확인 필요 [참고] Open Source Project Name Checker

57. RELEASE!2017년 6월8일, v1.0.0 공개

58. 그러나, 공개한다고 갑자기 관심과 사용자가 몰려오진 않는다. 홍보전략 필요

59. 직접 발로뛰기 다수의 'ECHO' 사이트에 등록하기 JavaScript Live Echo JS Hacker News 많은 곳에서 해당 사이트에 등록된 정보를 활용, 재전파 한다.

60. 뉴스레터 소개 요청하기 JavaScript Weekly [참고] FE 관련 뉴스레터는 사실, 한 곳에서 발행  https://cooperpress.com/

61. 유력 매체 소개     JavaScript Weekly 소개 JavaScript Daily 소개

62. GITHUB TRENDING!JavaScript 언어부문 3위 기록 [참고] https://github.com/trending/javascript

63. GITHUB STAR 공개 후, 첫 6일간 700개 14일 후, 1,000개 도달! Star의 가치는?  cdnjs 등록은 최소 200개 요구됨 Vuejs도 첫 6일간 615개 How I Got From 0 to 1 000 Stars on GitHub in Three Months

64. THIRD-PARTY APPS!Angular, React, R, Web Components 등의  자발적인 프로젝트들의 등장 [참고] https://github.com/naver/billboard.js/wiki/Third-party-applications

65. 지속적 성장월 npm 다운로드 수 June 370 July 479 Aug 862 Sep 1,124 [참고] npm-stat: billboard.js, 2017.6.8 ~ 9.30

66. 충실한 문서문서 작성은 아주, 아주 중요하다. 대표 사이트:  C3.js에서 마이그레이션 하기 가이드 잘 작성된 API 문서 왜 Fork 하게 되었나? Readme https://naver.github.io/billboard.js/

67. 80여개의 풍부한 예제많은 예제는 '무엇'이 가능 또는 할수 있는지 보여줄 수 있다.  https://naver.github.io/billboard.js/demo/

68. 이제 부터가 시작 Star의 수는 보다 발전할 수 있도록 도와주는 역할 이슈에 대한 빠른 대응 필요 신규 기능과 버그에 대한 처리 을 통해 향후 방향에 대한 정보제공Roadmap

69. 사용자를 위한 지속적 기능 추가

70. PLAYGROUND온라인에서 바로 옵션들을 수정하고 확인  [참고] https://naver.github.io/billboard.js/playground/

71. 신규 옵션들과 문서 C3+ 경험들을 통한 신규 옵션  꾸준한 문서 업데이트 API는 한번 작성되면 끝이 아니다. 정확한 의미와 동작을 기술 그리고 지속적 업데이트

72. 오픈소스의 중요한 요소들 안정성, 충분한 문서 그리고 책임감 [참고] http://opensourcesurvey.org/2017/

73. 오픈소스의 어려움누군가의 노력이 대가없이 제공되는 것.  그러나, 쉽게 비난 받기도 한다.   https://twitter.com/spf13/status/907403135592878080

74. 의연하게 대처하기 You shouldn’t let strangers on the internet negatively affect your mood or your drive  ...  The trolls feed on your  annoyance and discourse.  ― Sindre Sorhus [참고]   Between the Wires: An interview with open source developer Sindre Sorhus 1,139 npm Packages

75. WHY DO OPEN SOURCE? 세상에서 내가 도움 받은 것에 대해  다시 기여하는 의미있고 가치있는 행동 [참고]   네이버 오픈소스 가이드 GitHub Open Source Guides

76. SPECIAL THANKSMASAYUKI TANAKA AND ALL OF THE C3.JS CONTRIBUTORS,  FOR YOUR GREAT EFFORTS AND WORKS TO THE COMMUNITY!

77. 고맙습니다.  Thank You.  Gracias.  https://github.com/naver/billboard.js/


...

반응형
반응형
JointJS: JavaScript diagramming library


Chart, Graph, javascript


JointJS is a JavaScript diagramming library. It includes basic diagram elements, interactive elements and links, touch support, animations, and more.

jointjs

Homepage: http://jointjs.com/
GitHub: https://github.com/DavidDurman/joint
Demo Page: http://jointjs.com/demos


http://jointjs.com/rappid


.Supported browsers

Only the good ones (those that support SVG):

  • Latest Google Chrome (including mobile)
  • Latest Firefox
  • Safari (including mobile)
  • IE 9+


반응형
반응형

Circliful: Circular loaders with jQuery


Circliful is a jQuery plugin that makes it easy to add circular loaders to your webpages. Configurable options allow you to loading text and info text, and you can even use half-circles.

circliful


반응형
반응형

Epoch: A real-time charting library

Epoch is a real-time, general purpose charting library for building high-performance visualizations. It’s built for developers and is easy to extend and adapt, and offers unified styling with a CSS querying engine that lets you style SVG and Canvas elements from one stylesheet.

epoch


반응형
반응형

Choosing the right visualization tool for your task


http://blog.datamarket.com/2012/04/04/choosing-the-right-visualization-tool-for-your-task/


@ Chart Sites

https://developers.google.com/chart/?hl=ko-KR&csw=1

http://raphaeljs.com/

http://mbostock.github.io/protovis/

http://d3js.org/

https://github.com/mbostock/d3

https://github.com/mbostock/d3/wiki/Gallery

http://www.tableausoftware.com/

http://www.tableausoftware.com/learn/gallery

http://www.visualdatatools.com/DataGraph/

http://ggplot2.org/

http://processing.org/

http://www.highcharts.com/

http://www.highcharts.com/demo/

The right tool for the task

Simple one-off charts

The most common tool for simple charting is clearly Excel. It is possible to make near-perfect charts of most chart types using Excel – if you know what you’re doing. Many Excel defaults are sub-optimal, some of the chart types they offer are simply for show and have no practical application. 3D cone shaped “bars” anyone? And Excel makes no attempt at guiding a novice user to the best chart for what she wants to achieve. Here are three alternatives we’ve found useful:

  • Tableau is fast becoming the number one tool for many data visualization professionals. It’s client software (Windows only) that’s available for $999 and gives you a user-friendly way to create well crafted visualizations on top of data that can be imported from all of the most common data file formats. Common charting in Tableau is straight-forward, while some of the more advanced functionality may be less so. Then again, Tableau enables you to create pretty elaborate interactive data applications that can be published online and work on all common browser types, including tablets and mobile handsets. For the non-programmer that sees data visualization as an important part of his job, Tableau is probably the tool for you.
  • DataGraph is a little-known tool that deserves a lot more attention. A very different beast, DataGraph is a Mac-only application ($90 on the AppStore) originally designed to create proper charts for scientific publications, but has become a powerful tool to create a wide variety of charts for any occasion. Nothing we’ve tested comes close to DataGraph when creating crystal-clear, beautiful charts that are also done “right” as far as most of the information visualization literature is concerned. The workflow and interface may take a while to get the grips of, and some of the more advanced functionality may lie hidden even from an avid user for months of usage, but a wide range of samples, aggressive development and an active user community make DataGraph a really interesting solution for professional charting. If you are looking for a tool to create beautiful, yet easy to understand, static charts DataGraph may be your tool of choice. And if your medium is print, DataGraph outshines any other application on the market.
    • The best way to see samples of DataGraph’s capabilities is to download the free trial and browse the samples/templates on the application’s startup screen.
  • R is an open-source programing environment for statistical computing and graphics. A super powerful tool, R takes some programming skills to even get started, but is becoming a standard tool for any self-respecting “data scientist”. An interpreted, command line controlled environment, R does a lot more than graphics as it enables all sorts of crunching and statistical computing, even with enormous data sets. In fact we’d say that the graphics are indeed a little bit of a weak spot of R. Not to complain about the data presentation from the information visualization standpoint, most of the charts that R creates would not be considered refined and therefore needs polishing in other software such as Adobe Illustrator to be ready for publication. Not to be missed if working with R is the ggplot2 package that helps overcome some of the thornier of making charts and graphs for R look proper. If you can program, and need a powerful tool to do graphical analysis, R is your tool, but be prepared to spend significant time to make your outcome look good enough for publication, either in R or by exporting the graphics to another piece of software for touch-up.
    • The R Graphical Manual holds an enormous collection of browsable samples of graphics created using R – and the code and data used to make a lot of them.

Videos and custom high-resolution graphics

If you are creating data visualization videos or high-resolution data graphics, Processing is your tool. Processing is an open source integrated development environment (IDE) that uses a simplified version of Java as its programming language and is especially geared towards developing visual applications.

Processing is great for rapid development of custom data visualization applications that can either be run directly from the IDE, compiled into stand-alone applications or published as Java Applets for publishing on the web.

Java Applets are less than optimal for web publication (ok, they simply suck for a variety of reasons), but a complementary open-source project – Processing.js – has ported Processing to JavaScript using the canvas element for rendering the visuals (canvas is a way to render and control bitmap rendering in modern web browsers using JavaScript). This is a far superior way to take processing work online, and strongly recommended in favor to the Applet.

The area where we have found that Processing really shines as a data visualization tool, is in creating videos. It comes with a video class called MovieMaker that allows you to compose videos programmatically, frame-by-frame. Each frame may well require some serious crunching and take a long time to calculate before it is appended to a growing video file. The results can be quite stunning. Many of the best known data visualization videos are made using this method, including:

Many other great examples showing the power of Processing – and for a lot more than just videos – can be found in Processing.org’s Exhibition Archives.

As can be seen from these examples Processing is obviously also great for rendering static, high-resolution bitmap visualizations.

So if data driven videos, or high-resolution graphics are your thing, and you’re not afraid of programming, we recommend Processing.

Charts for the Web

There are plenty – dozens, if not hundreds – of programming libraries that allow you to add charts to your web sites. Frankly, most of them are sh*t. Some of the more flashy ones use Flash or even Silverlight for their graphics, and there are strong reasons for not depending on browser plugins for delivering your graphics.

We believe we have tested most of the libraries out there, and there are only two we feel comfortable recommending, each has its pros and cons depending on what you are looking for:

  • Highcharts is a JavaScript charting library that renders vector based, interactive charts in SVG (or VML for older versions of Internet Explorer). It is free for non-commercial use, and commercial licenses start at $80. It is a flexible and well designed library that includes all the most common chart types with plenty of customization and interactivity options. Interestingly enough even though Highcharts is a commercial solution, the source code is available to developers that want to make their own modifications or additions. With plenty of examples, good documentation and active user forums, Highcharts is a great choice for most development projects that need charting.
  • gRaphaël is another JavaScript charting library built on top of Raphaël (see below). Like HighCharts, gRaphaël renders SVG graphics on modern browsers, falling back to VML for IE <9. While holding a lot of promise, gRaphaël is not a very mature library and with limited capabilities, few chart types, even fewer examples and pretty much non-existent documentation. It is however available under proper open source licenses and could serve as a base for great things for those that want to extend these humble beginnings.

Other libraries and solutions that may be worth checking out are the popular commercial solution amCharts, Google’s hosted Chart Tools and jQuery library Flot.

Special Requirements and Custom Visualizations

If you want full control of the look, feel and interactivity of your charts, or if you want to create a custom data visualization for the web from scratch, the out-of-the box libraries mentioned above will not suffice.

In fact – you’ll be surprised how soon you run into limitations that will force you to compromise on your design. Seemingly simple preferences such as “I don’t want drop shadows on the lines in my line chart”, or “I want to control what happens when a user clicks the X-axis” and you may already be stretching it with your chosen library. But consider yourself warned: The compromises may well be worth it. You may not have the time and resources to spend diving deeper, let alone writing yet-another-charting-tool™

However, if you are not one to compromise on your standards, or if you want to take it up a notch and follow the lead of some of the wonderful and engaging data journalism happening at the likes of the NY Times and The Guardian, you’re looking for something that a charting library is simply not designed to do.

The tool for you will probably be one of the following:

  • Raphaël, gRaphaël’s (see above) big brother. Raphaël is a powerful JavaScript library to work with vector graphics. It renders SVG graphics for modern browsers and falls back to VML for Internet Explorer 6, 7 and 8. It comes with a range of good looking samples and decent documentation. Raphaël is open source, and any developer should be able to hit the ground running with it to develop nice looking things quite fast. We don’t recommend Raphaël for the advanced charting part, but for entirely custom data visualizations or small data apps it may very well be the right tool for the task.
  • Protovis is an open source JavaScript visualization toolkit. Rather than simply controlling at a low level the lines and areas that are to be drawn, Protovis allows the developer to specify how data should be encoded in marks – such as bars, dots and lines – to represent it. This approach allows inheritance and scales that enable a developer to construct custom charts types and layouts that can easily take in new data without the need to write any additional code. Protovis natively uses SVG to render graphics, but a couple of efforts have been made to enable VML rendering making Protovis an option for older versions of Internet Explorer that still account for a significant proportion of traffic on the web.

    Protovis is originally written by Mike Bostock (now data scientist at Square) and Jeffrey Heer of the Stanford Visualization Group. Their architectural approach is ingenious, but it also takes a bit of an effort to wrap your head around, so be prepared for somewhat of a learning curve. Luckily there are plenty of complete and well-written examples and decent documentation. Once you get going, you will be amazed at the flexibility and power that the Protovis approach provides.

  • D3.js or “D3″ for short is in many ways the successor of Protovis. In fact Protovis is no longer under active development by the original team due to the fact that its primary developer – Mike Bostock – is now working on D3 instead.

    D3 builds on many of the concepts of Protovis. The main difference is that instead of having an intermediate representation that separates the rendering of the SVG (or HTML) from the programming interface, D3 binds the data directly to the DOM representation. If you don’t understand what that means – don’t worry, you don’t have to. But it has a couple of consequences that may or may not make D3 more attractive for your needs.

    The first one is that it – almost without exception – makes rendering faster and thereby animations and smooth transitions from one state to another more feasible. The second is that it will only work on browsers that support SVG so that you will be leaving Internet Explorer 7 and 8 users behind – and due to the deep DOM integration, enabling VML rendering for D3 is a far bigger task than for Protovis – and one that nobody has embarked on yet.

반응형
반응형

Cytoscape.js


Cytoscape.js (GitHub: cytoscape / cytoscape.js, License: LGPL, npm: cytoscape), developed at the Donnelly Centre at the University of Toronto by Max Franz, is a graph library that works with Node and browsers. This library is for working with “graphs” in the mathematical sense – interconnected sets of nodes connected by edges.

The API uses lots of sensible JavaScript idioms: it’s event-based, functions return objects so calls can be chained, JSON definitions of elements can be used, and nodes can be selected with selectors that are modelled on CSS selectors and jQuery’s API. That means you can query a graph with something like this: cy.elements('node:locked, edge:selected').

Styling graphs is also handled in a natural manner:

Graph style and data should be separate, and the library should provide core functionality with extensions adding functionality on top of the library.

Max and several contributs have been working on the project for two years now, so it’s quite mature at this point. The project comes with detailed documentation, a build script, and a test suite written with QUnit.

반응형

+ Recent posts