반응형
https://pypi.org/project/rich/
rich
Render rich text, tables, progress bars, syntax highlighting, markdown and more to the terminal
pypi.org
Rich is a Python library for rich text and beautiful formatting in the terminal.
The Rich API makes it easy to add color and style to terminal output. Rich can also render pretty tables, progress bars, markdown, syntax highlighted source code, tracebacks, and more — out of the box.
python -m pip install rich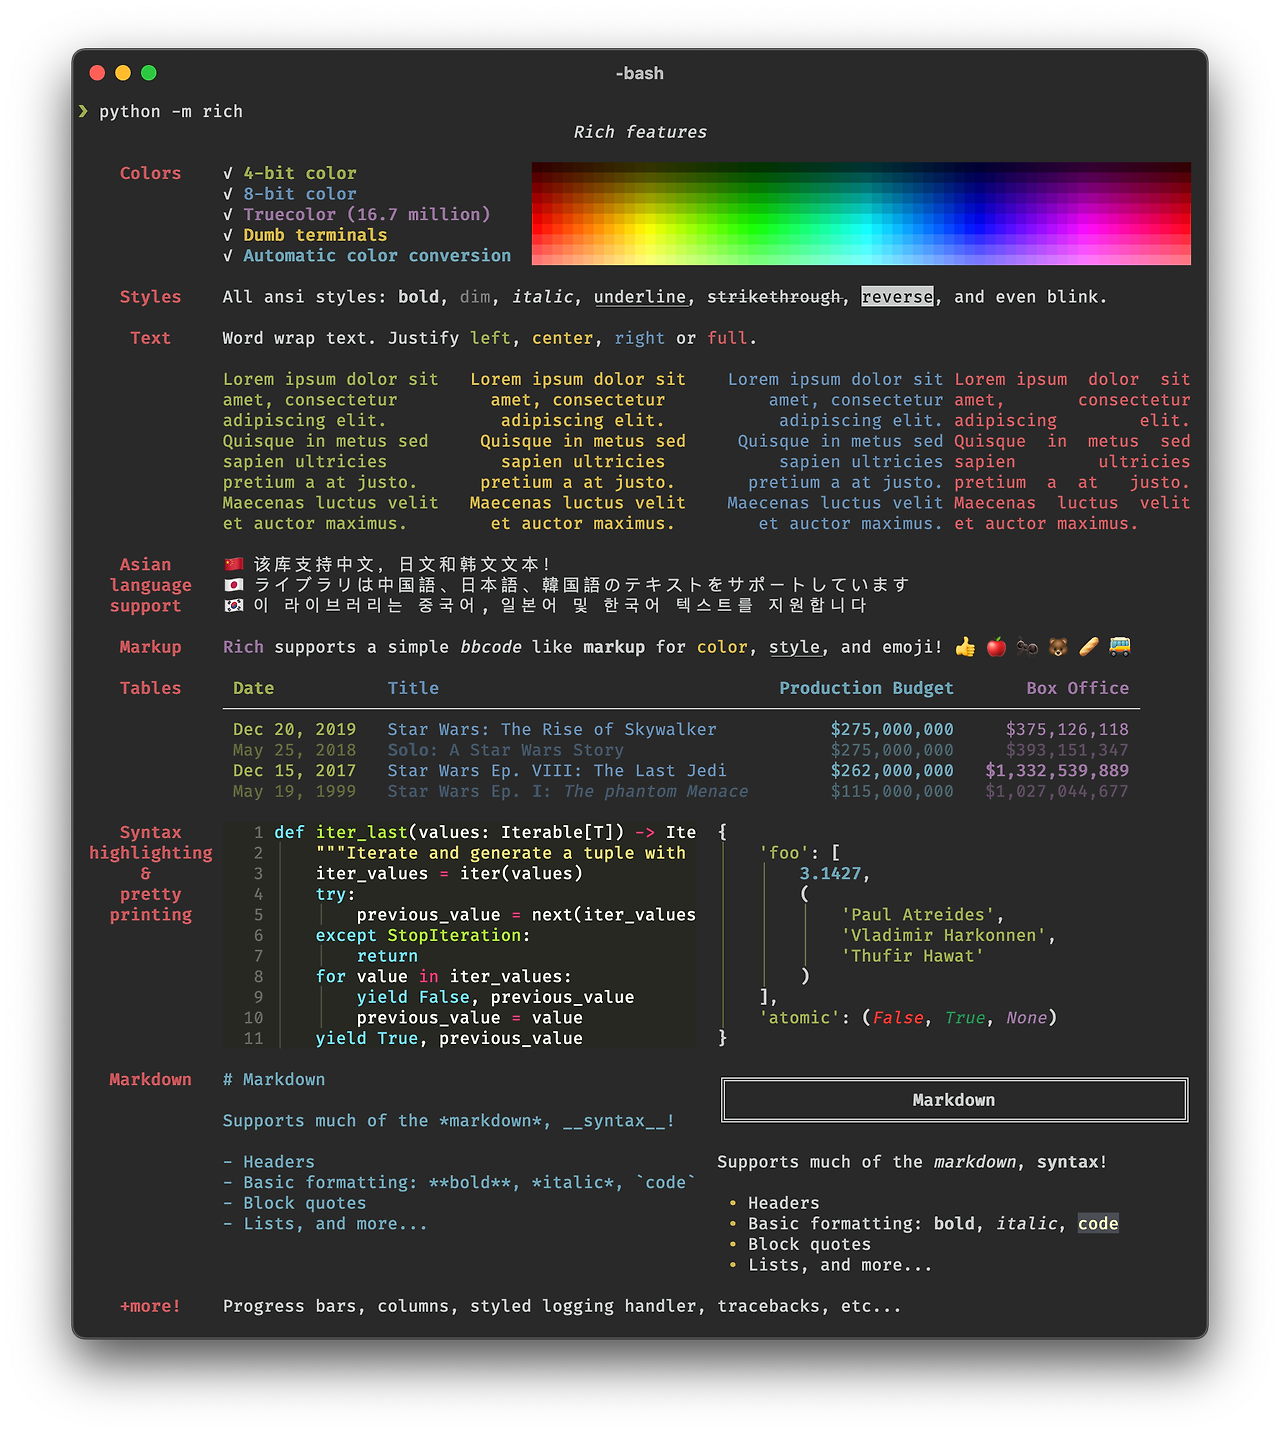
from rich.progress import Progress
import time

def main():
    with Progress() as progress:
        task1 = progress.add_task("[cyan]Downloading...", total=100)
        task2 = progress.add_task("[magenta]Processing...", total=200)

        while not progress.finished:
            time.sleep(0.03)  # Simulate some work
            progress.update(task1, advance=1)
            progress.update(task2, advance=0.5)

if __name__ == "__main__":
    main()
from rich.progress import Progress
import time

def main():
    # Create a progress bar
    with Progress() as progress:
        # Add a task
        task = progress.add_task("[cyan]Processing...", total=100)

        # Update progress
        for i in range(100):
            time.sleep(0.05)  # Simulate some work
            progress.update(task, advance=1)  # Advance the progress bar by 1

if __name__ == "__main__":
    main()
반응형
'프로그래밍 > Python' 카테고리의 다른 글
| [python] pair plot (1) | 2024.12.20 |
|---|---|
| [python] Generate OTP using python (1) | 2024.12.13 |
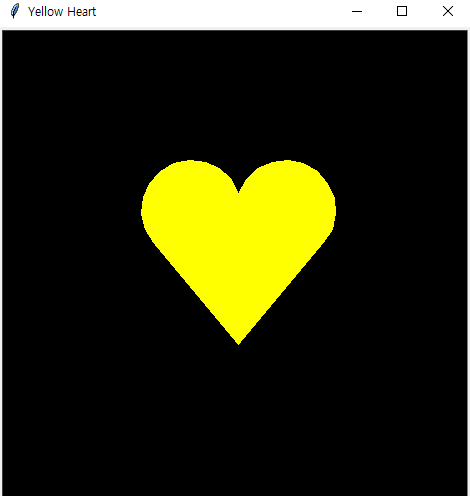
| [python] Code: Turtle Yellow Heart on Black Background (0) | 2024.12.06 |
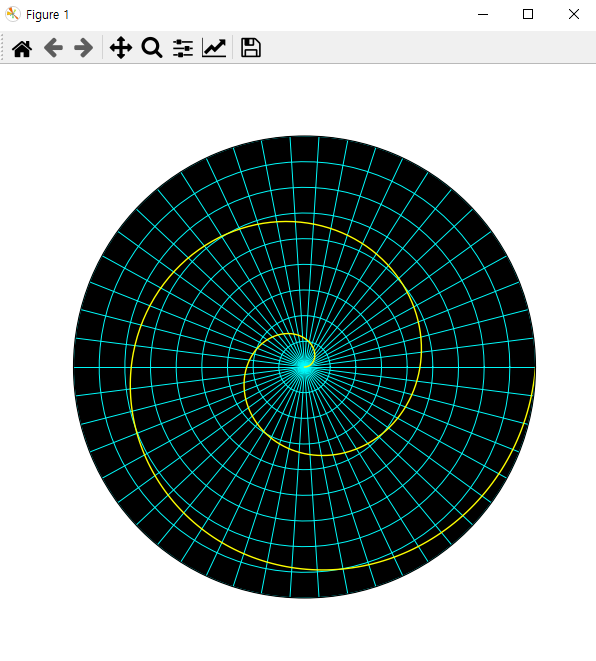
| [python] Spiral Web using Matplotlib and NumPy (0) | 2024.12.03 |
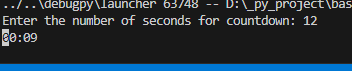
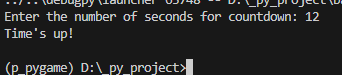
| [python] 초를 입력 받으면 카운트다운 하는 간단한 타이머 (0) | 2024.12.02 |


 Dependencies